English
  Vietnamese
 Your business just obtained Infor CloudSuite Industrial and the system has proven to be effective in boosting collaboration and enhance transparent communication cross-department. However, the data you are presented with still overwhelming and might take some time to get used to.
Whether you work in Sales or Customer Service department, you need to keep up-to-date with the changing customer's demands. How to at least make some sense out of them and accurately predict the next customer's demand?
Read more: How ERP revolutionises manufacturing: problems and solutions
Previously, we have discussed various indicators frequently used by Executives and Controllers. Click here to read Part 1!

Infor CloudSuite Industrial for Sales Managers
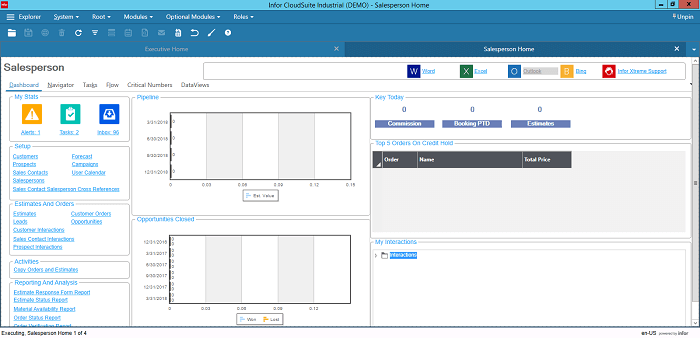
Place your mouse pointer over any column to see the value.
The Pipeline chart shows the expected total value of the salesperson in a given sales period, which is determined by calculating the sum of the estimated value of all opportunities in a given sales period where no close date exists.
The Opportunities Closed chart shows all closed opportunities for a given period, which is determined by calculating the sum of the estimated value of all opportunities in a given sales period where a close date exists.
The Key Today chart shows:
- Commissions: This shows the amount that is due to the salesperson in local currency.
- Booking PTD: This shows the order booking amount for the current period for the salesperson in local currency.
- Estimates: This estimates the outstanding amount for the salesperson in local currency.
Read more: Production demand forecasting: How to do it right?
Infor CloudSuite Industrial for Customer Service Managers
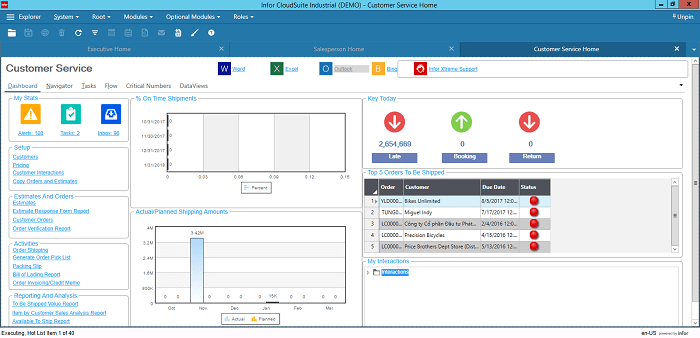
You can hover your mouse pointer over any column to see the value.
The % On Time Shipments chart shows the percentage of on-time shipments for the last three accounting periods and the current period. The formula used to get Y-Axis data is [count number of lines with a due date in the time period (where line due date ≥ date shipped and quantity ordered ≤ quantity shipped)] / [count number of lines with a due date in time period].
The Actual/Planned Shipping Amounts chart shows the previous three months, the current month, and the next two months based on the current date. The formulas used to get Y-Axis data are:
- Last three months: Total of all order shipments per month
- Current month: (Total order shipments in a month) + (sum lines with a due date in a month ((quantity ordered - quantity shipped) x price)))
- Next two months: (Sum lines with a due date in a month ((quantity ordered - quantity shipped) x price))
Read more: Why ERP is moving to the cloud
The Key Today chart shows the number of late orders as of today (current date), the number of orders placed or updated today, and the amount of RMAs entered today. The three components of the Key Today chart are:
- Late: Customer order item price * (quantity ordered - quantity shipped). This applies to all customer order items with a status of "Planned or Ordered", the due date is before the current date, and the quantity shipped is less than the quantity ordered. The value is in local currency.
- Booking: This shows net order amount entered "today". The value is in local currency.
- Return: This shows net return amount entered "today". The value is in local currency.
Continue reading Part 3 or Subscribe to TRG Blog and get instant notifications when we publish new content or talk to our experts by requesting a free Infor CloudSuite Industrial demo today!