If you are new to Business Intelligence (BI), navigating through its terminology is not an easy thing to do, which is why we are here to help.
A and B - Analytics and Business Intelligence
The term ‘Business Intelligence’ was invented in 1989 by the consulting firm Gartner and has been popularised since then. Business Intelligence (BI) refers to technologies, processes, and skills needed to gather, analyse data, and turn data into actionable insights.
In recent years, however, vendors and industry experts have been using the terms ‘Business Analytics’ or ‘Analytics’ more frequently. A quick research using Google Trends so how much popularity the term ‘Business Analytics’ (red) has gained during the last 5 years in comparison with ‘Business Intelligence’ (blue).
Read more: How Grab Uses Data Analytics to Refine New Products

These terms often are used interchangeably and can cause quite a bit of confusion. The increasing popularity of the terms ‘Analytics’ and ‘Business Analytics’ can partly be explained by recent advancements in data analytics (in-memory, advanced algorithms, A.I., machine learning, etc.) which have given a massive boost to business intelligence software’s power.
Read more: How Data Analytics is changing hotel revenue management
Some vendors and experts may explain business analytics/analytics refers to more advanced technologies, those that are more proactive and forward-looking as opposed to traditional business intelligence software which is more reactive and backwards-looking.
Still, such explanation is more of a marketing tool than an actual difference. Modern BI solutions also come with advanced analytics such as predictive and prescriptive modelling that can truly go beyond reflecting the past business performance.
Read more: 3 best Business Intelligence & Analytics vendors 2017
To add to the confusing, ‘analytics’ can be considered one of the three main components of a BI solution. The other two components are the data warehouse and dashboards/reporting.
In most cases though, ‘Business Intelligence’, ‘Business Analytics’, and ‘Analytics’ can be used interchangeably.
C - Data Cube
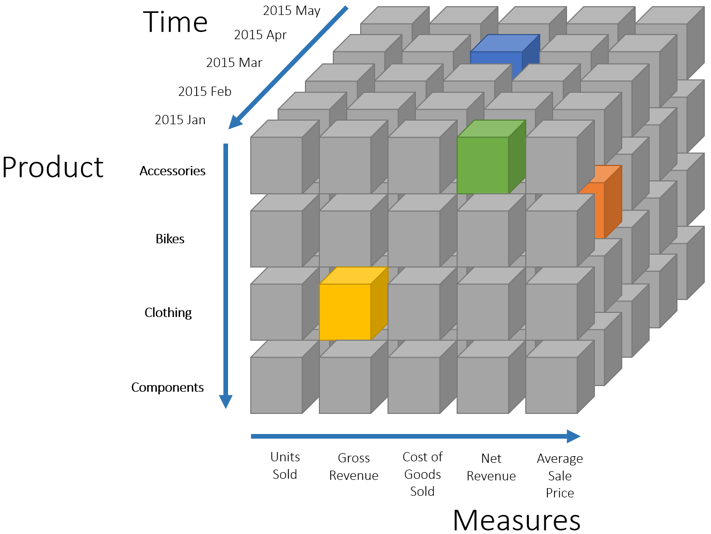
A data cube is a multidimensional array of values and is used to represent data along some measure of interest, according to the definition on Wikipedia. The number of dimensions of a data ‘cube’ can be higher than three. For example, a sales data cube can have the following dimensions: Time, Location, and Item.
A business intelligence solution may deal with multiple data cubes. Each cube can belong to certain departments or individuals.

D- Dashboard
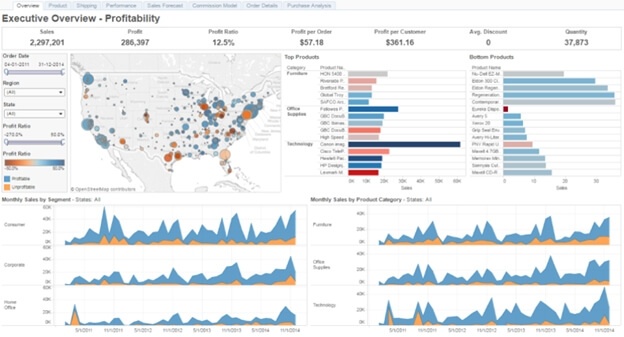
A BI dashboard is a collection of visualisations that monitors a business performance and facilitates decision making by displaying the status of metrics and KPIs, often on a single screen.
A modern BI solution should allow for the ability to customise dashboards based on users’ specific roles.
Read more: How a Financial Shared Services Centre benefits from analytics software

An example of BI dashboard
E- ETL
Business intelligence software essentially collects and analyses data from other enterprise applications such as ERP, CRM and accounting software. The process in which data from different systems is pulled from the source systems and placed into the BI solution’s data warehouse is called ETL (Extract – Transform – Load).
The Extract step copies data from the source systems. By doing so, the performance of the source systems will not be affected by later analysis operations. Each system can have a different data format. This step also makes sure only the desired data sets are extracted.
In the Transform step, the extracted data is cleaned, for e.g. mapping N/A to 0 or ‘M’ to ‘Male’. Other rules or functions can also be applied to prepare the data for data warehousing, such as selecting or deselecting certain columns, combining or splitting columns, transposing columns and rows, etc.
The Load step moves the transformed data into the BI solution’s data warehouse where it can be further analysed.
This is the 1st part of our article. Read the 2nd part now or subscribe to our blog for the latest content about Business Intelligence and Analytics.
 English
  Vietnamese


