If you are new to Business Intelligence (BI), navigating through its terminology is not an easy thing to do, which is why we are here to help.
Read more: Part 1 | Part 2 | Part 3
S - Slicing and Dicing
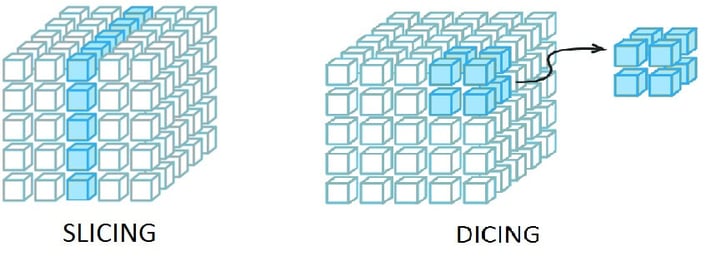
Slicing and dicing is to break a data cube into smaller parts in order to view it from different points of view. The process is repeated until the user has reached the desired level of detail.
Slicing is producing a new data cube with one fewer dimension by locking on a single value of that dimension. Dicing is producing a new data cube by picking specific values of various dimensions.

T - Tableau
Tableau was founded in 2003 by 3 geniuses from Stanford University and has since been synonymous with innovation and excellence in Business Intelligence & Analytics. The Gartner’s 2017 Magic Quadrant for Business Intelligence and Analytics Platforms places Tableau in the Leader quadrant for the fifth time.
Out of numerous BI & Analytics vendors in the market, only 3 are in the leader positions. Tableau solutions are being used by 39,000 users in many organisations of all sizes in 150 countries, from businesses to government agencies to not-for-profit organisations.
Read more: Tableau 10.2 is now available in the cloud
U - User Experience
Modern BI software can unlock your business’ full potential by giving everyone the power to gain insights from data. Unlike legacy systems, these inspiring and easy-to-use solutions are built from scratch with the user-centric approach. So that any ordinary business user can be an expert in BI without relying on specialists.
This can only be achieved with the product design that took into account the way humans naturally ask questions, process information, and discover the answers.
Read more: How Grab Uses Data Analytics to Refine New Products

V - Visualisation
As human beings, we process information much better with visual cues. Patterns and trends emerge from dull numbers thanks to engaging charts, graphs, maps, and dashboards. Every single element of a data visualisation should be deliberately chosen to maximise the user’s comprehensive capability: which colours are included in the colour palettes, which shapes are used.
W - Data Warehouse
A data warehouse is a central repository of all data collected from one or multiple enterprise systems. In a business intelligence system, the data warehouse is where data from other source systems is stored after it has been cleaned by the ETL (extract, transform, load) process. This data will later be used in analysis operations.
Whereas a database is designed to handle transactions and often stores only the current data that is in use, a data warehouse is designed to handle reporting and analytics and stores both current and historical records.
Z - Zero-latency enterprise
Zero-latency enterprise is an organisation where information can flow freely across organizational boundaries without any delay. As a result, it can effectively respond to business events as they occur.
Subscribe to our blog for the latest content about Business Intelligence and Analytics.
 English
  Vietnamese


