Infor CloudSuite Industrial (previously known as Infor SyteLine) has long been favoured by many as a highly secure and reliable ERP solution for your everyday manufacturing and distributing needs.
The latest edition (9.01) offers a wide range of benefits, allows deep manufacturing functionality, flexibility as well as a much lower TCO.
Read more: Maximise manufacturing productivity with Infor CloudSuite Industrial 9.01
Though Infor's products are known as user-friendly, many of its functionalities still require a bit of understanding. And that's the exact reason for this blog post, to make every client's experience as painless as possible.
Real-time Business Indicators
If you cannot measure it, you cannot do it. The question is how to define what you can measure, just enough indicators set for an organisation which is designed with management support towards the organisation goals. When the level of organisation is established, it sets out down to process and job level:
- Organisation
- Process
- Job
Enterprises need to determine real-time indicators and help managers keep the ship on courses. Each high-level indicator is engineered to set metrics for indicators at the lower levels.
This is the first in a 4-part series on how to fully understand critical statistics in Infor CloudSuite Industrial for each key position in the organisation.
Infor CloudSuite Industrial for Executives

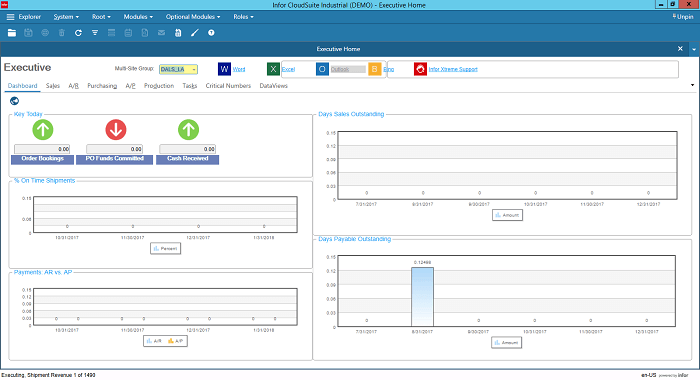
- Order Bookings: the order booking amount that was entered today. The net price is the sum of all order lines created today from all companies in the group.
- Purchase Order Funds Committed: the Purchase Order amount that was entered today. The cost is the sum of all order lines created today from all companies in the group.
- Cash Received: the cash received today from all company in the group.
The % On-Time Shipments chart displays the percent of orders, by period, that was on time.
The Payments: Accounts Receivable (AR) vs Accounts Payable (AP) chart displays Total Cash In and Total Cash Out.
The Days Sales Outstanding chart shows the average number of days to collect revenue after a sale has been made.
- A low Days Sales Outstanding (DSO) means that it takes a company fewer days to collect its accounts receivable.
- A high DSO number shows that a company is selling its product to customers on credit and taking longer to collect money.
- The amounts are calculated using the following formula: [Accounts Receivable / Total Credit Sales] * Number of Days.
The Days Payable Outstanding chart shows the average payable period, and is calculated using this formula: [Accounts Payable / Cost of Sales] * Number of Days.
Read more: 7 questions a CEO should consider before starting an ERP project
Infor CloudSuite Industrial for Controllers

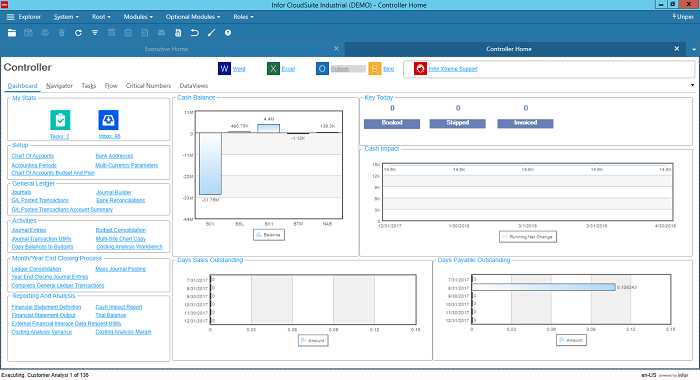
You can hover your mouse pointer over any of the column to see the data value for that column.
The Cash Balance chart shows the domestic balance for each bank code.
The Days Sales Outstanding chart shows the average number of days to collect revenue after a sale has been made.
- A low DSO number means that it takes a company fewer days to collect its accounts receivable.
- A high DSO number shows that a company is selling its product to customers on credit and taking longer to collect money.
- The amounts are calculated using the following formula: [Accounts Receivable / Total Credit Sales] * Number of Days.
The Key Today chart shows three different sets of data:
- Booked: This shows the sum of all customer orders ordered or updated "today" in local currency.
- Shipped: This shows the sum of all customer orders shipped "today", converted to domestic currency.
- Invoiced: This shows the sum of everything invoiced "today", converted to domestic currency.
The Cash Impact chart plots the running net change from the cash impact report based on the default options for the domestic currency.
The Days Payable Outstanding chart shows the average payable period and is calculated using the following formula: [Accounts Payable / Total Vouchered Purchases] * Number of Days.
Read more: The 2017 predominant ERP trend: Verticalisation
Read the remaining of the series here: Part 2 | Part 3 | Part 4
Subscribe to TRG Blog and get instant notifications when we publish new content or talk to our expert by requesting a free Infor CloudSuite Industrial demo today!
 English
  Vietnamese


