Obtaining real-time business indications are crucial to every key managerial role in the organisation. Enterprises need to determine real-time indicators and help managers keep the ship on courses. Each high-level indicator is engineered to set metrics for indicators at the lower levels.
This is the third in a 4-part series on how to fully understand critical statistics in Infor CloudSuite Industrial.
Infor CloudSuite Industrial for Production Planners

You can hover your mouse pointer over any column to see the value.
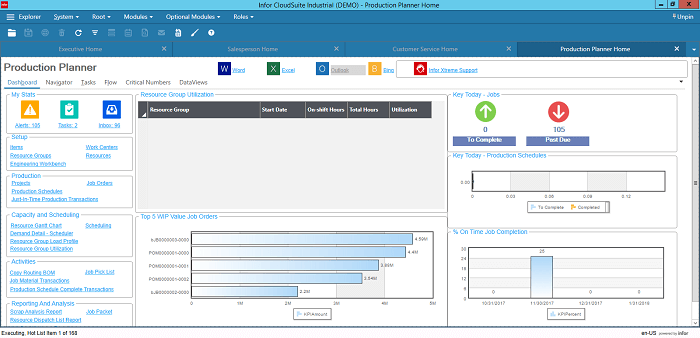
The Top n WIP Value Job Orders chart shows the top n WIP value job orders.
The Key Today - Jobs chart shows the number of jobs that are supposed to be completed today and the number that are late today.
The Key Today - Production Schedules chart shows the production schedule quantity that is to be completed today (quantity released - quantity complete) and the quantity completed today.
The % On Time Job Completion chart shows the percent on-time job completion for the last three accounting periods and the current period, using the following formula: [Count # of jobs with End Date in the time period where (End Date ≤ Last Transaction Date and Qty Released ≤ Qty Completed)] / [Count # of jobs with End Date in the time period].
Read more: APS - a key integration for modern manufacturing ERP
Infor CloudSuite Industrial for Buying Managers

You can hover your mouse pointer over any column to see the value.
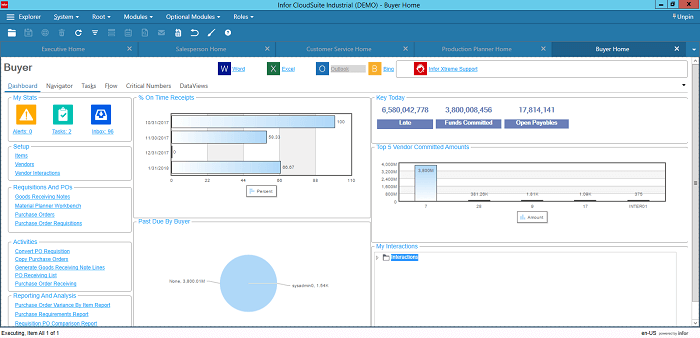
The % On Time Receipts chart shows the percentage of on-time receipts for the last three accounting periods and the current period. The formula used to get Y-Axis data is [count number of lines with the due date in the time period where (line due date >= date received and quantity ordered <= quantity received)] / [count number of lines with the due date in the time period].
Read more: Healthcare ERP boosted by cloud-based supply chain management
The Past Due By Buyer pie chart shows the sum of purchase order item costs (purchase order item cost * (quantity ordered - quantity received)) in local currency, grouped according to buyer. If the buyer on the purchase order is blank, the buyer of the item is used. If that buyer is also blank, "None" is used.
The Key Today metric provides three pieces of information:
- Late: This shows the total amount of all purchase order item (purchase order item cost * (quantity ordered - quantity received)) in local currency where PO status is "Planned or Ordered"; the due date is prior to the current date, and the quantity received is less than the quantity ordered.
- Funds Committed: This shows the total amount of all purchase order item (purchase order item cost * quantity ordered) in local currency where the status of the PO line is "Open".
- Open Payables: This shows the total amount of all open balances for all vendors in local currency.
The Top n Vendor Committed Amounts chart shows the top 5n vendor committed amounts. The formula used to get Y-Axis data is the sum ((quantity ordered - quantity received) x cost)) for all PO lines with a status "Open" by the vendor.
Continue reading Part 4 or Subscribe to TRG Blog and get instant notifications when we publish new content or talk to our experts by requesting a free Infor CloudSuite Industrial demo today!
 English
  Vietnamese


