In the previous post, we discovered the first five most common Business Intelligence terms you need to know. In today's post, we will go through the next six.
Learn more: Data analytics and its role in modern business

F - Forecasting
Forecasting is among the most crucial yet trickiest aspects of any business. Comprehensive and timely insights provided by business intelligence software can deliver a giant leap in forecasting capability.
BI software aggregates data, which normally is scattered across multiple spreadsheets and systems, and provides a single source of truth. This data is then further analysed and turned into accurate, timely, and easy-to-understand reports, visualisations, and dashboards.
As a result of these insights, companies can discover trends and patterns more easily, and hence make better forecasts about procurement, manufacturing, sales and marketing, etc.
Infographic: How CFOs can help improve sales forecasting
G - Geospatial analysis
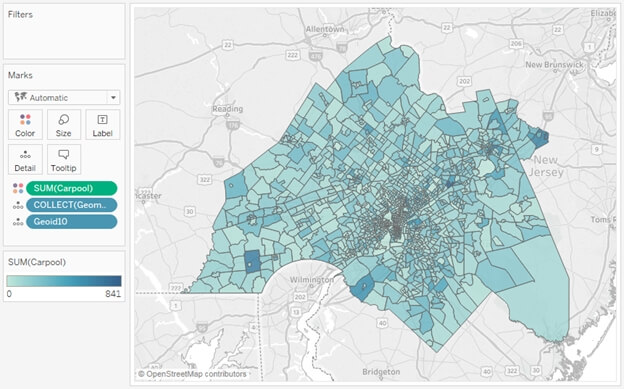
Geospatial analysis is the application of analytics to geographical or spatial data. As such, it is vital to many industries like retail, distribution, energy, and transportation.
Geospatial analysis can combine geographic information system (GIS) data such as GPS, satellite imagery with business data from systems like ERP and CRM. It can also include data from other sources like the Internet of Things’ sensors.
This information helps businesses answer questions like “Where are our target customers living?” or “Which areas of the city are most traffic-congested?” by just looking at a map on the dashboard.

H - Hadoop
Hadoop is an open-source framework for Big Data storage and analysis. Before Hadoop, it was very expensive to store and analyse huge sets of data. Hadoop lets you add more storage simply by add new commodity computers to a Hadoop cluster.
Infographic: 4 Steps to Automate Enterprise Data Management
I - Interactive Dashboards
Modern BI solutions greatly enhance user engagement through direct interaction with dashboards and the underlying information. Users can gain deeper insights more quickly with just a few clicks.
With interactive dashboards, users can drill down, filter, highlight data or create links to other online materials. These interactive dashboards can also be shared to increase organisation-wide collaboration.
K - KPIs
Key performance indicators (KPIs) are among the most important sources of business performance information. Modern business intelligence solutions can display the KPIs in visual presentations that are easy-to-understand and even in real-time. More important, users can interact with the KPIs and drill down to the underlying metrics that drive such KPIs.
L - Data Literacy
Data literacy is the ability to make sense of data, turn it into useful information, and communicate that information to others.
In order to improve data literacy, many companies seek specialists like data scientists or data engineers. Some go one step further and appoint a Chief Data Officer (CDO).
Infographic: 10 most valuable technical skills
However, data democratisation is a growing trend in today’s business. That is, every member of an organisation has access to data and the ability to analyse that data. Democratising data enables everyone, from a C-level executive to an entry-level staff, to answer their own questions and make more informed decisions.
This is why self-service analytics is another hallmark of modern BI. It enables non-technical users to make use of BI solutions without the help of specialists.
Click HERE to continue reading the 3rd part of the series or subscribe to our blog for the latest content about Business Intelligence and Analytics.
 English
  Vietnamese


